

In this article, we will take a deep dive into the ETH merge and switch to POS in the case of number of transactions, block generation per day, and ETH price changes. We will also explore active wallets before and after the merge. In addition, we can see here how the ETH Merge impacts AAVE in different metrics.
The Merge: What does it mean? Why should we merge?
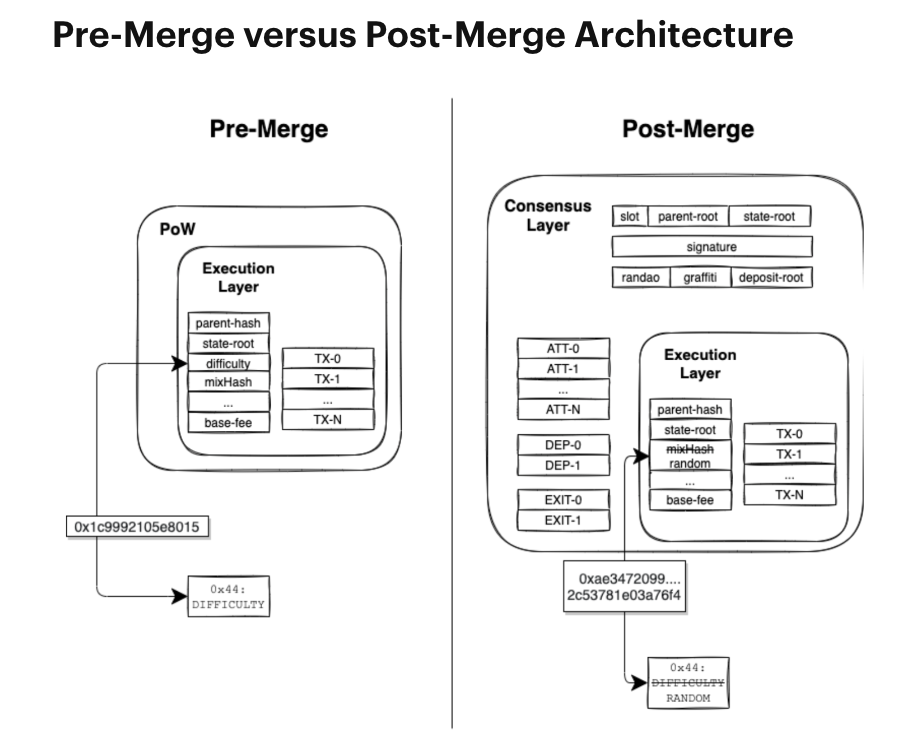
With the merge, Ethereum makes the transition from proof-of-work (PoW) to proof-of-stake (PoS). The proof-of-work method of consensus on the blockchain relies on the lockup of a staker’s Ethereum. Computing power is required to secure blockchain consensus. This is done by people (miners) who secure the network.
In order to solve the blockchain trilemma, Ethereum has worked on a variety of problems:
Security , decentralization and scalability the blockchain so far has compromised on at least one of these features. However, it is still helpful.
What are the benefits of the Merge?
The Merge allows for decentralization and security by requiring a minimal number of nodes and reducing the amount of work required to run nodes Compared to PoW, PoS requires 99% less energy Through scalability, it opens the possibility of sharding and 100k TPS in the future.
How does it works ?
- Ethereum is deposited into your account.
- Validators stake cryptocurrency with the protocol.
- You receive the staked ETH in the form of a liquid (sellable) wrapper.
- You will earn interest on that. If you want, you can trade in these liquid wrappers.
Ethereum Merge: When Did It Happen?
A long-awaited Merge occurred on Sept. 15 at 6:42:42 UTC at block 15,537,393, bringing together the Ethereum mainnet execution layer with Beacon Chain’s consensus layer at a Terminal Total Difficulty of 58,750,000,000,000,000,000,000, ending the use of a proof-of-work consensus system. With the Merge, the Ethereum network will have an energy efficiency of 99.95% and will be able to implement future scaling solutions, such as sharding.
In the tweet below, we can see that the Ethereum Merge has been completed
And we finalized!
— vitalik.eth (@VitalikButerin) September 15, 2022
Happy merge all. This is a big moment for the Ethereum ecosystem. Everyone who helped make the merge happen should feel very proud today.
Approach
Let’s discuss how the AAVE protocol has changed before and after the Ethereum Merge, as well as the post-Merge changes in different metrics
- Let’s take a look at how many blocks are generated per day
- How many transactions are on average per block?
- Daily transactions and active wallets
- Changes in the price of the ETH Token
- Volume of Flash Loans on Aave
- Average Amount Of Flash Loans Per Transaction on Aave
- Number of Wallets Taking Flash Loans on Aave – 11 Day Period
- Number of Wallets Taking Flash Loans on Aave
- Unique Borrowers vs Suppliers On Aave – Pre & Post Merge
- The amount borrowed from Aave and the amount supplied by Aave
- Top Supplied and Borrowed Tokens On AAVE Before & After Merge
Analysis Of ETH Post Merge Changes Based On Various Metrics
We can see the impact of the ETH post merge in various areas in this section. In the graph below, we can see how many blocks have been generated every day since Sept 4th 2022. We can see here that the After Merge contributes the most (55.55%) to the total Blocks out of the two periods. September 25, 2022 saw the highest number of blocks at 7.17K, and September 14, 2022 saw the lowest number of blocks at 5.91K. We can conclude from this that there was an increase in the number of blocks generated per day after the merge. In this sense, the ETH Merge was successful in achieving some of its objectives, like improving the processing speed.
The following graph shows the average number of transactions per block since Sept 4 2022. As a result, we can see that the number of transactions per block has decreased after the merge when compared to before the merge. More blocks were created in order to improve processing speed, and transactions per block were divided into those blocks to reduce processing time. The maximum Transactions Per Block of 188.14 was observed on September 15, 2022, and the minimum Transactions Per Block of 154.47 was observed on September 25, 2022. The total number of transactions per block decreased by 9% from 177.56 in September 4, 2022 to 161.58 in September 26, 2022.
From the belwo graph we cans ee the number of transactions processed per day since Sept 4 2022. The maximum number of transactions was 1.32M on September 17, 2022, and the minimum number was 998.16K on September 10, 2022. We can conclude from this that the number of transactions processed per day increased after the merger initially. But later we can see the number of transactions precessed per day were in decreasing trend.
There is an increase in the number of active wallets after the merge, compared to before the merge. The total number of active wallets between September 4, 2022 and September 26, 2022 was 9.02 million. The maximum number of active wallets was 566.23K on September 17, 2022, and the minimum number was 341.41K on September 7, 2022. There is an increasing trend in active wallets. September 17, 2022 has a higher number of active wallets than usual.
Compared to the before merger failure transaction percentage, we can see the failed transaction rate decreased after the merge when analyzing the daily average number of transactions per block.
As can be seen in the graph below, Ether tokens have come down in value after the ETH merger. The maximum Eth Price of $1.76K was observed on September 11, 2022, and the minimum Eth Price of $1.28K was observed on September 22, 2022. A 16% decrease in the total Eth price occurred between September 4, 2022 and September 26, 2022, from $1.56K to $1.31K. Maybe it’s because many token holders transferred their tokens to CEX before the merge. Once the news about the merger spread, they were all going to sell their ETH tokens. By doing this, the price of ETH will be impacted, and we can also speculate this is a market tactic.
AAVE Protocol Analysis Following ETH Merge
This section examines how the AAVE protocol has responded to the ETH merge based on different metrics.
On a daily basis since Sept 4th 2022, the flash loans volume on AAVE can be seen in the graph below. A maximum Flash Loan Volume of $5.25M was observed in September 20, 2022, and a minimum Flash Loan Volume of $44.36K was observed in September 4, 2022. September 22, 2022, had a lower total flash loan volume than normal. From 21 September 2022 to September 22nd 2022, the number of AAVE flash loans dropped from 4M to 1M. As we can see, there is not much flash loan volume after the ETH merge. However, there is a large amount of flash loan activity on AAVE on Sept 21 and 22 2022. There may have been whale inclination on AAVE during that time period that caused this..
Here from the below graph we can see the average amount of flash loans per transaction on AAVE since Sept 4th 2022. September 20, 2022 was the day when the maximum Avg Flash Loan Amt was $145.94K, and September 4, 2022 was the day when the minimum Avg Flash Loan Amt was $3.41K. Total average Flash Loan Amount is higher than normal on September 20, 2022. Again, we see an increasing trend when it comes to average flash loan amounts.
From the below graph, we can see how many wallets have taken flash loans on AAVE over the past 11 days. Among the 2 periods, Period After Merge contributed the most (58.09%) to total Flash Loan Wallets.
Here from the below graph we can see the number of wallets which are taking flash loans on AAVE are increased after the ETH merge. But gradually they were coming down trend . Even though they are in down trend the number of wallets taking flash loans are more after the merge only. That means we can say the trend of number of wallets taking flash loans on AAVE are in increasing . Maximum Wallets of 42 was observed in September 19, 2022 and minimum Wallets of 8 was observed in September 4, 2022.
The maximum number of suppliers was 644 on September 6, 2022, and the minimum number was 243 on September 26, 2022. The maximum number of borrowers was 325 on September 19, 2022, and the minimum number of borrowers was 122 on September 8, 2022. After the ETH merger, we can now see the decreasing trend of unique suppliers and the increasing trend of unique borrowers on AAVE. After the merge initially they both were in increasing trend.
The maximum borrowed amount was $194.81M on September 6, 2022, and the minimum borrowed amount was $16.15M on September 8, 2022. Compared to their previous days, September 20, 2022 and September 7, 2022 have a lower total borrowed amount than usual. There has been a downward trend in the borrowed amount on AAVE since the merger.
It was immediately evident after the merge that the supply amount to the AAVE increased a lot, but later on we were able to see a decreasing trend in the amount supplied to the AAVE. It is true that the supplied amount to AAVE is currently on a downward trend when compared with the amount supplied before the merger as well.
From the graph below, we can see which tokens have been most frequently supplied on AAVE since Sept 4 2022. As you can see, the number of USDC tokens supplied decreased after the merge. As a result of the merge, AAVE now has a greater supply of WBTC and WETH tokens.
As shown in the graph below, the most frequently borrowed tokens on AAVE have been since Sept 4 2022. After the merge, USDC and WBTC tokens were borrowed less frequently on AAVE. In the case of WETH and CRV tokens, the borrowed tokens were increased after the merge.
Observations
- Based on the above analysis, we can conclude that the number of blocks generated per day increased after the merge. Therefore, the ETH Merge succeeded in achieving some of its objectives, such as improving processing speed.
- Therefore, we can see that there are fewer transactions per block after the merge than before. The number of blocks was increased in order to increase processing speed, and the number of transactions per block was divided into those blocks to reduce processing time. September 15, 2022, recorded 188.14 Transactions Per Block, and September 25, 2022, recorded 154.47 Transactions Per Block.
- The number of active wallets is on the rise. The number of active wallets on September 17, 2022 is higher than usual. Therefore, we can say that this Ethereum Merge attracts a greater number of users.
- Compared to the before merger failure transaction rate, the failed transaction rate has decreased after the merger when analyzing the daily average number of transactions per block.
- The total Eth price decreased from Sept 4 2022 to Sept 22 2022. It might be because many token holders transferred their tokens to CEX before the merger. As soon as word of the merger spread, they all sold their ETH tokens. ETH’s price will be impacted as a result of this, and we can speculate that it is a tactic being used by the market.
- In our analysis, there are not many flash loans on AAVE following the ETH merger. There is a large amount of flash loan activity on AAVE on Sept 21 and 22 2022, however. This may have been caused by whale inclination on AAVE during that time period.
- From the analysis, we can see that out of all wallets in 11 days, almost 58% of users are taking flash loans only after the Ethereum Merge.
- According to the above analysis, wallets that take flash loans on AAVE increased after ETH merged. Although they are on a downward trend now, the number of wallets taking flash loans has increased only since the merger. Accordingly, the number of wallets taking out flash loans on AAVE is increasing.
- AAVE shows a decreasing trend of unique suppliers and an increasing trend of unique borrowers after the ETH merger. Initially, both were in an increasing trend after the merger.
- Compared to before the merger, AAVE has had a downward trend in borrowed amounts. Comparing the amount supplied before and after the merger, the amount supplied to AAVE has been declining.
- Based on the analysis above, the number of USDC tokens supplied on AAVE decreased after the merger. As a result of the merge, AAVE now has a greater supply of WBTC and WETH tokens . In other words, after the merger, these tokens’ supply increased.
- On AAVE, USDC and WBTC tokens were borrowed less frequently after the merger. Since the merge, WETH and CRV tokens’ borrowed tokens have been increased.
Reference Query
with date_range as (
  	SELECT
  		dateadd(day,  -11, '2022-09-15') AS start_date,
  		dateadd(day, 12, '2022-09-15') as end_date
),
  supplied as (
  	select
  		date_trunc(day, block_timestamp) as date,
  		symbol,
  		sum(supplied_usd) as volume,
  		'Supplied' as Action
  	from ethereum.aave.ez_deposits
  	INNER JOIN date_range
  	WHERE block_timestamp between start_date and end_date
  	and supplied_usd > 1
  	GROUP BY date, symbol
  	QUALIFY row_number() over(partition by date order by volume desc) <= 10
),
borrowed as (
  	select
  		date_trunc(day, block_timestamp) as date,
  		symbol,
  		sum(BORROWED_USD) as volume,
  		'Borrowed' as Action
  	from ethereum.aave.ez_borrows
  	INNER JOIN date_range
  	WHERE block_timestamp between start_date and end_date
  	and BORROWED_USD > 1
  	GROUP BY date, symbol
  	QUALIFY row_number() over(partition by date order by volume desc) <= 10
)
SELECT * FROM supplied
UNION
SELECT * FROM borrowed