

In this dashboard we will take a closer look into Polygon blockchain performance. And also we will examine how block sizes and block times have changed over time.
Approach
- The Polygon Blockchain performance based on block times: In this section, we will check the overall Polygon block metrics, the average time between blocks, and the maximum and minimum time between blocks.
- The next section is a breakdown of block size performance on the Polygon Blockchain: Here, we can see the weekly average transactions per block, the maximum transactions per block, as well as the number of blocks on a weekly basis.
Introduction
Polygon solves one of the most painful problem of using Ethereum blockchain – gas prices are sky high and transactions are slow. With the gas prices on Ethereum sky rocketing to several hundreds of dollars during crazy days and 2 digit dollar figure on regular days, it is almost impractical for common person to use Ethereum. Polygon solves takes this problem on its head and solves it similar to Polkado, Cosmos with the following major upsides
- It is able to fully benefit from Ethereum’s network effects
- It is inherently more secure
- It is more open and powerful
How Polygon Works?
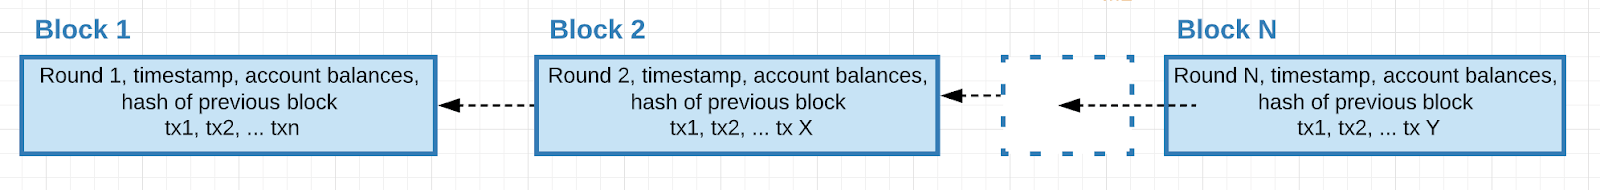
Polygon provides a L2 Layer, sidechain and framework for for building and connecting Ethereum compatible blockchains. In contrast to traditional blockchain technologies, Polygon functions primarily through the use of Commit chains, which aggregate batches of transactions into one large network and confirm them en masse before they are written to the main chain. The Polygon chain will eventually have thousands of channels scaling together to increase throughput. When connected to Ethereum’s main chain, it will one day be able to support millions of transactions per second.
Based on Block Times the Polygon Blockchain Performance
As you can see here in this overall of blocks in Polygon Blockchain, there is a time lag between blocks. The current average time lag between two blocks is close to 2.25 sec .
Based on my analysis, the maximum time lag between 2 blocks is 183 seconds, and the minimum is 2 second.
Here we can see in the following graph what is the average time difference between each block and what is the minimum and maximum time lag between each block on a weekly basis. And also here we can see the comparison of Average time lag with the other Layer 1 blockchains . If we compare Average time lag of Polygon with thw Algorand and Flow blockchains ,The average time lag of Polygon is in between these 2 blockchains.
Out of the 3 blockchains, Blockchain Algorand has the highest average time lag. Average Time Lag is lowest for Flow and highest for Algorand. There was an increase of 44% in Average Time Lag in W30, 2022. All blockchains show an increasing trend in average time lag. In W30, 2022, the total average time lag was higher than normal. Flow trended the most upward in Average Time Lag for W30, 2022, rising 246.48%. Average Time Lag is steady in Polygon .
It was initially observed that the maximum time lag was 25 during the week of July 3-9,2022, but after the network change it was reduced to 13 seconds during the week of July 17-23,2022.
As can be seen in the below graph, different blockchains have different minimum block times. It can be seen from the below graph that Polygon’s minimum time between blocks is usually 2 seconds. Based on a comparison of Polygon’s minimum time between blocks with other blockchains, the minimum time between blocks remains consistent.
Based on Block Size the Polygon Blockchain Performance
From the graph below, we are able to see Polygon and Algorand’s weekly block transactions. A maximum of 85 transactions per block were recorded in June 12-18, 2022, and a minimum of 66 transactions per block were recorded in July 3-9, 2022. Trends indicate an increase in transactions per block recently. Following the network adoption on the Polygon blockchain, the number of transactions per block has been rising. Following the adoption of the Polygon network, we can see the average number of transactions per block on Polygon is on an upward trend compared to the Algorand Blockchain. Additionally, we were able to find more transactions on Polygon than Algorand when comparing the two blockchains. Based on the below graph, we can conclude that Polygon has the highest average Txns per block and Algorand has the lowest average Txns per block.
As we compare the weekly maximum transactions per block between Polygon and Algorand, we can see the polygon maximum transactions have maintained consistency.
According to the weekly chart, the lowest number of blocks is 128.42K for Algorand, while the highest number is 242.24K for Polygon. A maximum number of blocks was observed in W24, 2022, while a minimum number of blocks was observed in W30, 2022. The average number of blocks in W30, 2022 is lower than normal. There are almost twice as many blocks from Polygon as Algorand, which indicates that there are more blocks coming from Polygon.
Conclusion
- According to the above analysis, Polygon’s average time lag is steady.
- From the above analysis, we can also see that polygon’s average transactions per block have increased after the network adoption compared to Algorand. As a consequence of our comparison, the Polygon blockchain has higher average transactions than Algorand.
- Initially, a maximum time lag was 25 seconds between July 3-9,2022; however, after the network changed, it became 13 seconds between July 17-23,2022.
- Comparing Polygon to other blockchains, the minimum time between blocks is maintaining consistency.
- Using the above analysis, we can conclude that Polygon has the highest average number of transactions per block, while Algorand has the lowest average number of transactions per block.
- When we compare the weekly maximum transactions on Polygon and Algorand, we can see the polygon maximum transactions are maintaining consistency.
- Comparing Polygon with Algorand, we can see that almost twice as many blocks are from Polygon, based on the weekly number of blocks.